

Background
In order to classify the stages of androgenetic alopecia, hair restoration surgeons use the 50-year-old Hamilton and Norwood (H-N) system that compares the patient’s hair loss pattern to a set of black and white drawings.1,2 Often, the pattern of loss does not correspond to one of the 12 H-N choices; but more importantly, the drawings are black and white, with no gray tones that depict partial loss. In spite of these limitations, the H-N system has remained the most popular method of classification.
The terminology used for scalp topography has limitations as well. The terms vertex and crown are often used interchangeably. The frontal area has been called hairline, transition zone, tuft, and forelock; and the frontal-temporal recession called the apex, angle, gulf, trough, corner, and triangle. The top of the head has been referred to as the mid-scalp, crown, bridge, lateral hump, and vertex. The persistent hair in Norwood VII has been identified with terms like permanent, occipital, parietal, fringe, rim, and donor area. The severity of hair loss has been described with terms like minimal, mild, moderate, and severe … but the words have no standardized definition. Communication in the field of hair restoration science surely demands more clarity and precision.
The following is a simplified revision of the Hair Loss Index, Profile, and Severity Scale, introduced by Cohen in 2003.3,4,5 The revised system adapts to an infinite number of density and distribution patterns, both male and female. Numbers, instead of words, identify scalp topography; and hair loss is scored with a single value from 1 to 100. The system attempts to solve the limitations of the H-N classification and the confusion of existing terminology.
Components of the System
TOPOGRAPHIC MAP: A 3-headed topographic map defines the distinct areas of the scalp affected by androgenetic alopecia. The illustrations themselves may be drawn upon to document graft placement, donor scars, scalp tumors, traumatic scars, and areas of alopecia areata, etc.
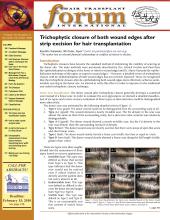
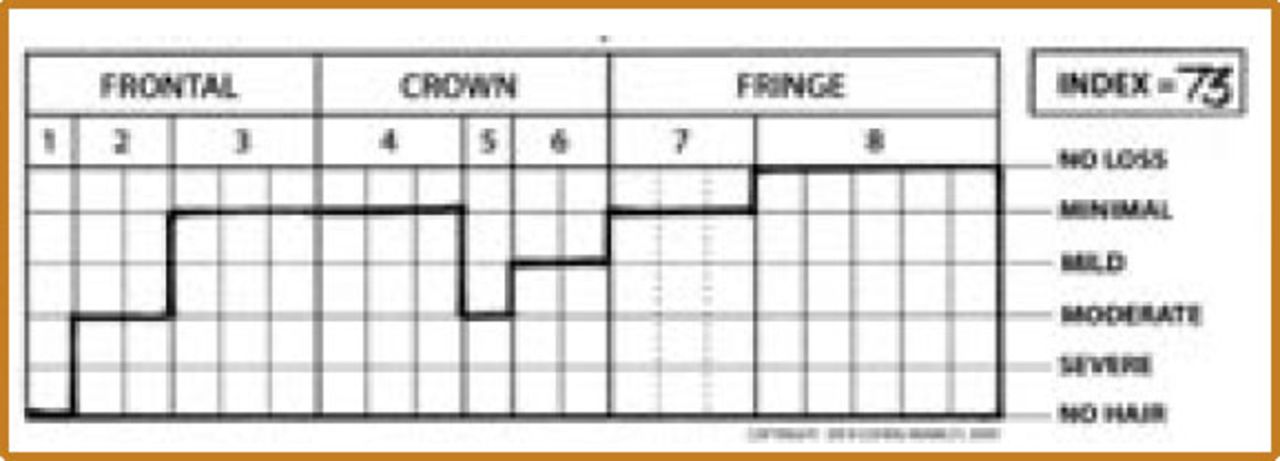
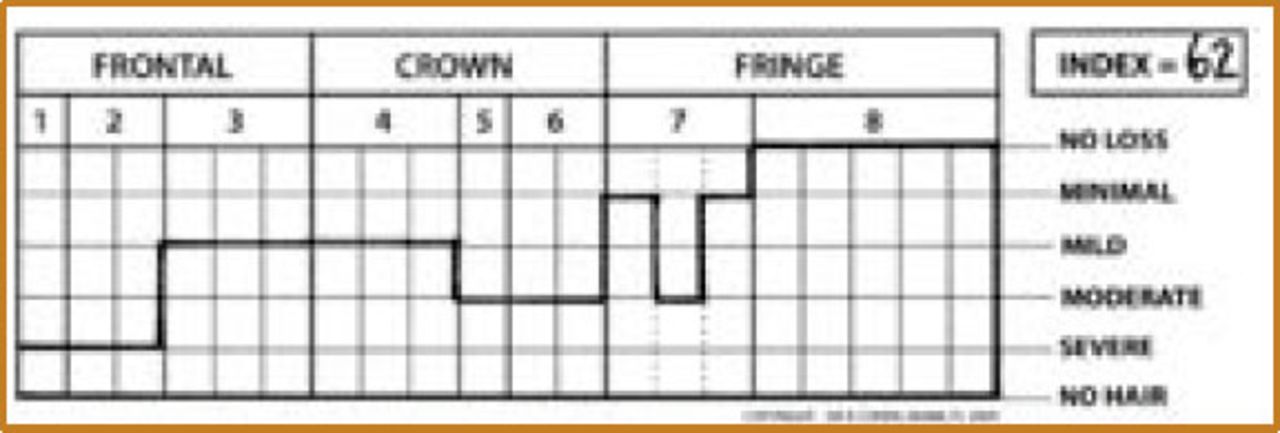
DISPLAY CHART: The chart contains 100 blank cells, divided into 3 general regions and 8 numbered zones: Frontal (1, 2, 3); Crown (4, 5, 6); Fringe (7, 8). The 100 cells are proportionately divided into 8 zones of relative anatomic size. Zone 8 has 25 cells, and represents 25% of the topographic map and chart (Figures 1 and 2).


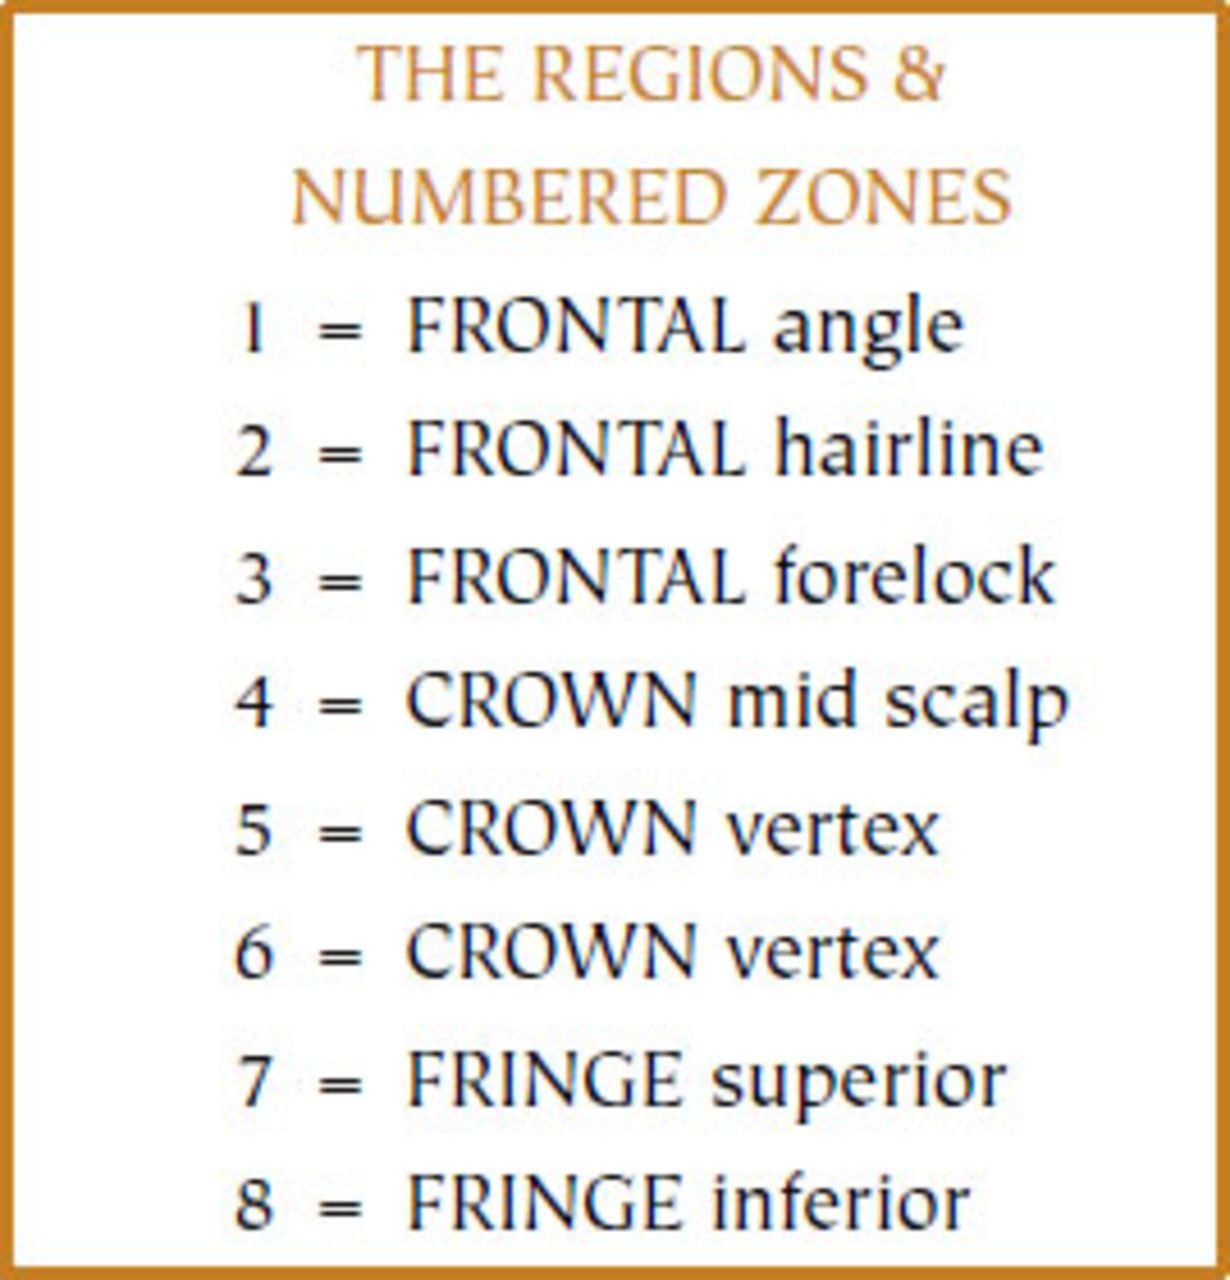
SEVERITY SCALE: The severity scale compares grossly visible hair to grossly visible skin, and requires the examiner to place the ratio of hair to skin into one of six categories (Figure 3). Standardized definitions and photographic examples of minimal, mild, moderate, and severe hair loss are provided (Figure 4).


Instructions
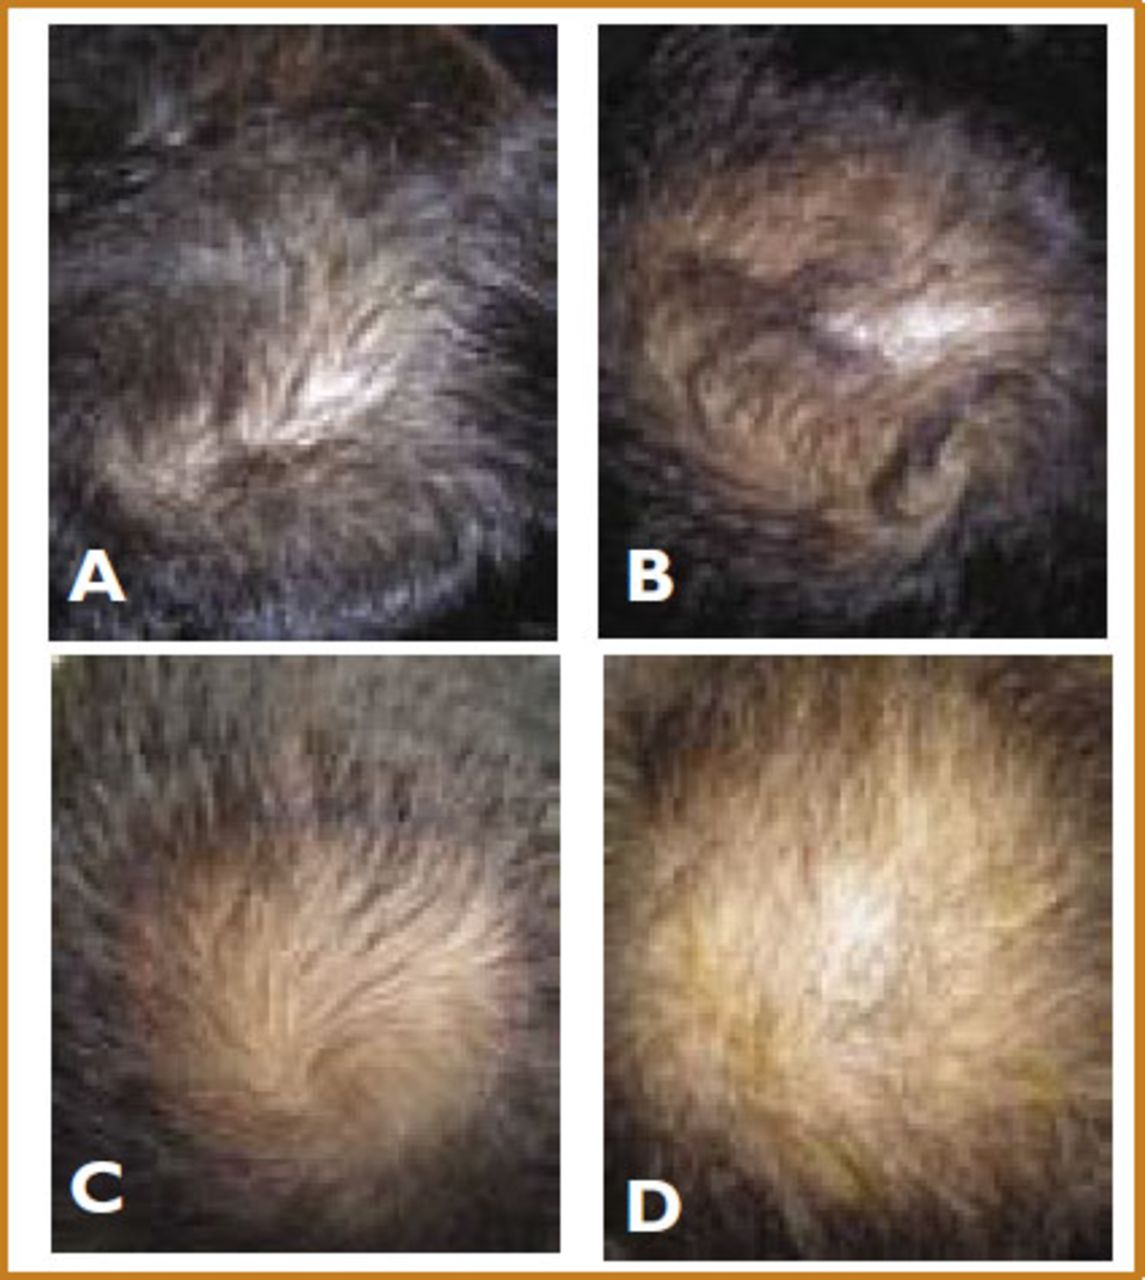
Visually assess the hair loss. Examine the scalp at arm’s length; magnification and manual manipulation are optional. Assess the ratio of hair to skin at the skin’s surface using the parameters defined in Figures 3 and 4. Hair length and curliness should not be a consideration. Broken and intact hairs have the same value. Blonde, gray, and brunette hairs are scored the same.
Plot the severity on the display chart. Plot the observed severity on the chart with a pencil line. Extend the line across all the columns in each of the numbered zones.
Generate Index and Profile. The number of cells beneath the irregular line becomes the hair loss Index. The completed bar graph becomes the hair loss Profile.
Anatomic Orientation Tips
When viewed from the side and back, the midline upper border of Zone 8 and the superior rim of the ear are at the same level. When viewed from above, Zone 4 spans an area between both ears. The two single dots represent 8.5cm and extend from the depth of the glabella to the mid point of the hairline. Use a flexible ruler to measure the distance. If the distance is 9.5cm or more, the hair in Zone 2 has been lost. You may use the eyebrows instead of the glabella when measuring the distance to the hairline. In that case, the defining distance between the dots would be 7.5cm.
Common Hair Loss Patterns
The basic instructions should be applied to all common hair loss patterns (Figures 5 and 6). Norwood VII patients have a Hair Loss Index of 25. Generalized shedding involves all 8 zones. Early vertex balding begins in Zone 5 and advances to Zone 6. Male frontal balding begins in Zone 1 and advances to Zones 2, 3, 4, etc. Female pattern balding usually begins simultaneously in Zones 1, 2, and 3. Zone 8 is the safe donor area for hair transplant surgery. The basic instructions apply to these common hair loss patterns. Figure 7 may be used as a guide to the hair-bearing zones in each of the Norwood categories.


Less Common Hair Loss Patterns
Hair loss will sometimes begin in the central portion of Zone 7 years before it advances to the lateral humps (parietal rami). In this situation, score the center column lower than the left and right columns. Dotted lines on the topographic map and display chart divide Zone 7 into thirds (Figure 8). Similar exceptions to the rule may be applied to Zone 4, when the loss is unequally distributed between the central and lateral thirds.

For patients with an isolated frontal forelock in Zone 3, score the center column higher than the left and right columns. For patients with a persistent frontal hairline, score Zone 2 higher than Zone 3.
Although Zone 8 is almost always scored as NO LOSS, it would be scored lower in patients with senile alopecia, telogen effluvium, post HT harvesting, etc. In female pattern alopecia, there is frequently more hair in the occipital fringe than the parietal fringe. In that situation, score the lateral columns lower than the center columns of Zones 7 and 8.
Hair transplant surgeons must appreciate that additional hair is not created by a transplant procedure. When hair is removed from Zone 8 and transplanted to Zones 5 and 6, the bar graph contour of the hair loss Profile will change; but the hair loss Index will remain the same.
Quick Start Mode
A quick start mode may be used for rapid screenings or patient self-evaluations. In this mode, assess only the frontal, crown, and fringe regions. Disregard the numbered zones and extend the pencil line across all columns of each respective region (Figure 9).

Discussion
The Cohen classification attempts to address the limitations of the H-N classification and existing terminology. It requires no more than a blank chart and pencil. It defines the scalp topography with a system of numbers rather than words. It generates an individualized profile with more information than any photograph can provide. It quantifies the cumulative hair loss with a single numeric score. It should be emphasized that the classification does not profile and quantify actual hair loss, but only visible hair loss. That is because a zone with “minimal” loss has already lost 50% of its hair before the loss is visible to the naked eye.6
Editors’ Note: This article is an abridged version of “The Cohen Hair Loss Index, Profile, and Severity Scale” as to be published in the textbook, “Hair Transplantation, 5th Edition,” editors: Unger WP, Shapiro RS, Unger RH, Unger MA, publisher: Informa Healthcare, 2010.
- Copyright © 2009 by The International Society of Hair Restoration Surgery
In this issue


Jump to section
Related Articles
Cited By...
- No citing articles found.